Wellington's Shitsville is real
Since I launched Can You Beat Wellington back in 2024, the most common complaint has been that the rules are too strict. The app judges a good Wellington day as: temperature at least 18°C, wind under 20 km/h, and no rain. Sounds reasonable. Turns out it basically never happens.
I now have six years of weather data in the database, so I asked Claude to analyse it and suggest better rules. The results were interesting, and they led me down a rabbit hole involving a very famous Wellington meme.
The current rules are basically broken
Six years of data. 2,290 days. Under the current rules, 50 of them were good days. That's 2.2%.
More damning: from May through October, there was not a single good day in the entire dataset. Not one. The wind threshold of 20 km/h is the main culprit. Wellington has wind under 20 km/h on only 12% of all days. We are, after all, the windiest city in the world.
Bar chart of Wellington daily wind speed distribution over six years. Only 12% of days fall under the old 20 km/h threshold. Raising to 30 km/h covers 39% of days.
Raising that to 30 km/h -- still genuinely light wind by Wellington standards -- unlocks another 27% of days. The 18°C temperature floor does the rest of the damage, particularly through the cooler months.
Shitsville is real, and the numbers prove it
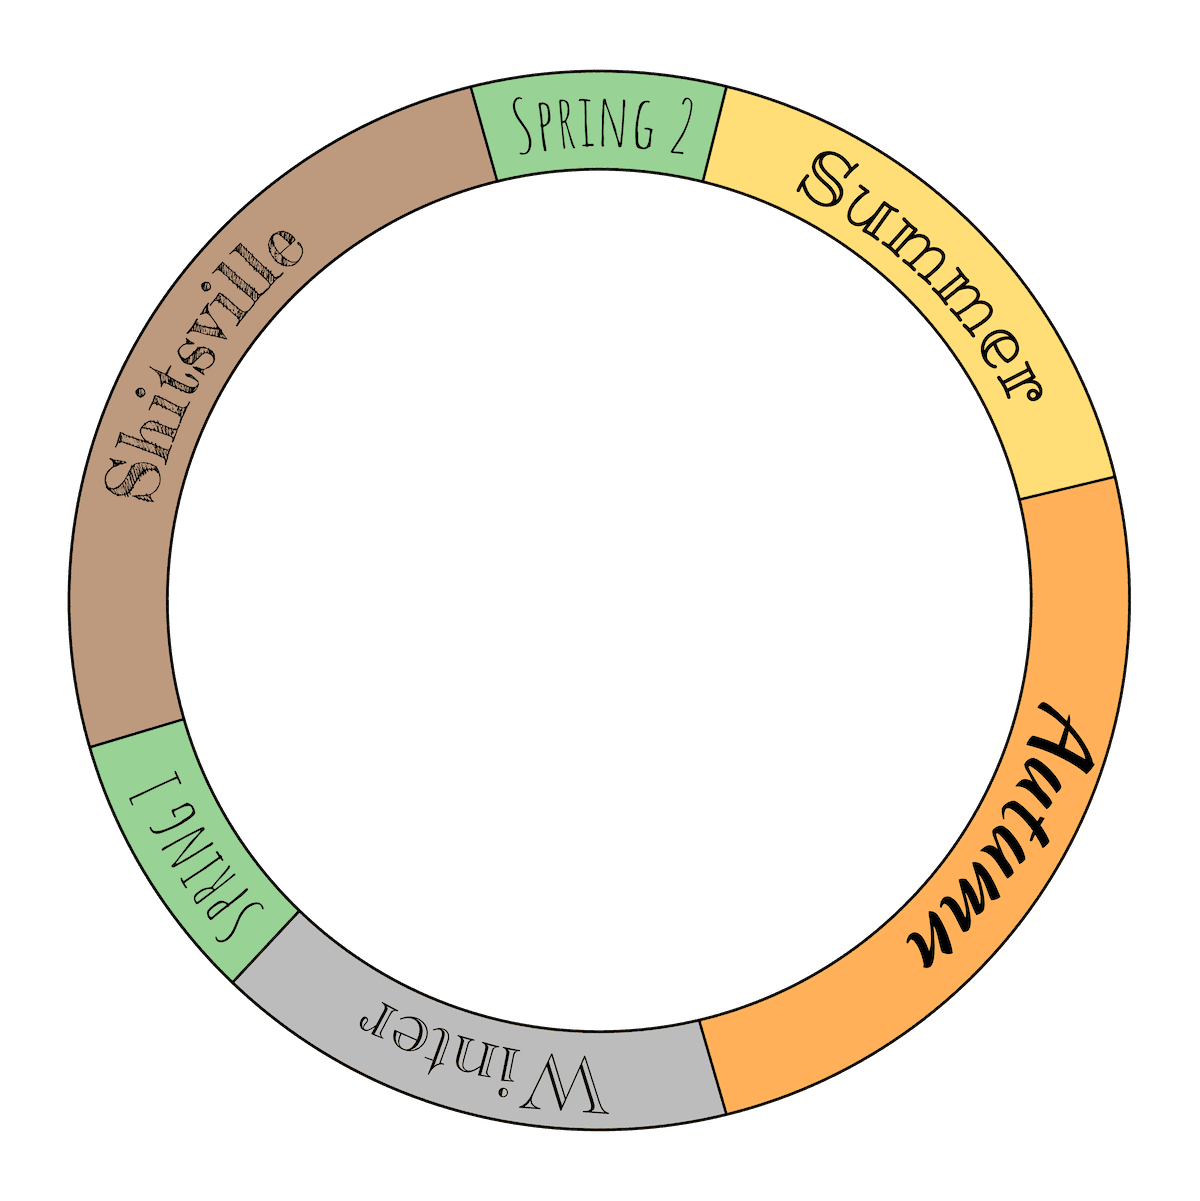
If you've spent any time in Wellington you'll know the Shitsville calendar, proposed by Adam Shand in a 2014 tweet that went viral. Wellington doesn't have four seasons, it has six:

Summer runs January through March. Autumn April through June. Winter July and August. Then September brings Spring 1 -- a brief, tantalising patch of fine weather. Then October and November are Shitsville. December is Spring 2, a cautious recovery before summer proper arrives.
Adam has said he wishes he'd called it "False Hope" or "Bait and Switch." The cruelty of Shitsville is that Spring 1 precedes it, setting expectations that October and November then systematically destroy.
Six years of weather data say he was onto something. Surprising no Wellingtonian, ever.
Season comparison cards and chart showing Shitsville has higher wind speeds and more rain days than Winter, statistically validating the Wellington Shitsville calendar.
The headline number: Shitsville (October and November) has higher average wind speeds than Winter (July and August). Winter averages 33.1 km/h. Shitsville averages 35.8 km/h. It's warmer than winter, but windier and with the highest rain day percentage of any season at 65%. It's the worst of both worlds -- not cold enough to feel properly wintery, but too wet and blustery to actually enjoy.
Spring 2 (December) tells a similar story: 35.2 km/h average wind and 62% rain days. The data firmly places December outside the summer category, which anyone who has been caught out without a jacket in early December already knows.
The new rules
The Shitsville calendar describes Wellington's actual weather better than the conventional four seasons, so it makes sense to build the rules around it. Here's the updated approach:
Wind: raising the cap to 30 km/h. Under 20 km/h covered only 12% of all days. Under 30 km/h is still meaningfully calm for Wellington -- you'd notice it, but you wouldn't be fighting for control of your umbrella.
Rain: staying at 0mm. Rain is rain. This one isn't moving.
Temperature: seasonal thresholds. A good day in each season should actually feel good for that time of year -- not just warm enough to technically qualify.
| Month | Season | New threshold |
|---|---|---|
| Jan, Feb, Mar | Summer | ≥19°C |
| Apr, May, Jun | Autumn | ≥16°C |
| Jul, Aug | Winter | ≥13°C |
| Sep | Spring 1 | ≥14°C |
| Oct, Nov | Shitsville | ≥16°C |
| Dec | Spring 2 | ≥18°C |
Here's what that produces:
Bar chart comparing percentage of good Wellington days per month under old rules versus new honest seasonal rules. Some months like June naturally produce zero good days.
A few things worth noting. The rules don't try to force an even distribution of good days across the year -- some months naturally have fewer, and that's fine. June produces zero good days under these rules. That's not a bug. June in Wellington averages 13.3°C, averages 31 km/h of wind, and has rain more than 60% of the time. A sensible temperature threshold of 16°C combined with the wind and rain requirements means June never gets a good day -- and across six years of data, that has held without exception.
Shitsville is similarly tough -- at 16°C+ with wind under 30 km/h and no rain, you get about 6% of days in October and November. That feels right. Good days do happen in Shitsville, but they're rare and you tend to remember them.
April is the standout surprise. It produces good days about 20% of the time -- making it not just the best month in Autumn, but one of the best months of the year. May manages around 5%, and June contributes nothing. So "Autumn" as a season is really just April doing the work while May and June quietly behave like winter.
What the data reveals
With six years of daily records now in the database, some patterns stand out.
The longest good-day streak on record is four days. It has happened a handful of times. Wellington doesn't do runs of nice weather -- it gives you a good day, sometimes two, then reasserts itself.
January 2022 was the best single month ever recorded: 10 good days out of 31, a 32% hit rate. No other month comes close. April shows up repeatedly in the top ten -- it appeared five times in the best months across all years, which tracks with the 20% average.
September is the windiest month, not winter. This one surprised me. In July and August, wind exceeds 30 km/h on about 70% of days. In September -- notionally Spring 1, the good bit -- it's 77%. September has the temperature and often the dry spells, but the wind guts it almost every time. The Spring 1 season is less "brief tantalising patch of fine weather" and more "warm enough to be cruel about how windy it is."
Year to year, there's no real trend. 2021 was the best year on record at 10.1% good days. 2024 was the worst at 7.9%. The variation is noise, not signal. Wellington is just like this.
The result across the year
Overall about 9% of all days qualify as good under the new rules. The rule set stops trying to pretend all seasons are equally capable of good days, and instead reflects what Wellington actually is: brilliant when it's good, and honest about when it isn't.
All historical data has been retroactively recalculated. Because isGoodDay is computed at runtime rather than stored in the database, the whole history updates for free -- one of the better decisions from the recent refactor.
The code is open source if you want to argue about the thresholds.
Replies
Reply on Mastodon →Loading replies…